 | ||||||||||||||||
Tuesday, August 17, 2010
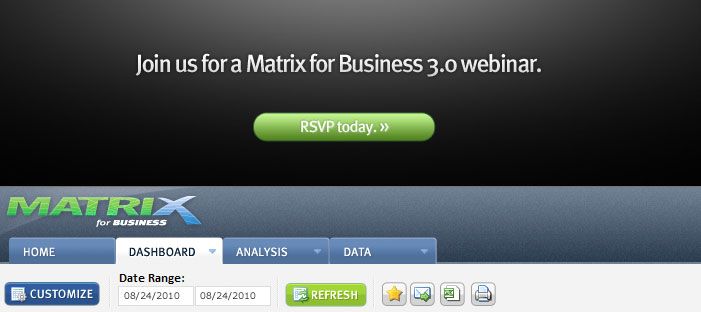
Join us for a Matrix for Business Webinar - August 24, 2010 at Noon CST
Friday, June 25, 2010
Microsoft SQL Server 2008 R2 Express
Microsoft made a huge leap with their free SQL Server 2008 R2 Express edition by increasing the per database size limit to 10 GBs. Add this to the fact that Reporting Services is available with the Advanced Services edition of SQL Server 2008 R2 Express and there’s real reason to jump up and down. This edition provides a great on-ramp for companies with smaller requirements to start using SQL Server without having to pay license costs. Of course, as additional features are required and the database size limit becomes restrictive, companies will want to consider moving to the fully licensed versions of SQL Server.
SQL Server 2008 R2 Express Overview
SQL Server 2008 R2 Express Editions
Thursday, June 24, 2010
Microsoft SQL Server 2008 R2 Release
Microsoft recently released SQL Server 2008 R2 which includes a whole host of new features and a heavy focus on improving business intelligence capabilities. Here are two links that explain new features and compares features in each edition of SQL Server 2008 R2.
What's New in R2
Edition Comparison
Friday, June 18, 2010
OFDealer June 2010 Issue highlights Matrix for Business - Technology in Action
The latest issue of OFDealer highlights Matrix for Business in the cover article "Technology in Action: Office Furniture Dealer Software." It provides a brief overview and case study of our client OfficeScapes. In this version of Matrix for Business, we've created custom analysis views and dashboards into Hedberg, the primary business system for Steelcase dealers.
Read more about how Matrix for Business enables Steelcase dealers to do more with their data.
Download the issue.
Read more about how Matrix for Business enables Steelcase dealers to do more with their data.
Download the issue.
Open publication online - Free publishing
Wednesday, June 9, 2010
Official Matrix for Business 3.0 Announcement and Webinar Invite
 | ||||||||||||||||||||||||||||||||
Labels:
Detail,
Matrix for Business,
Webinar
Sunday, June 6, 2010
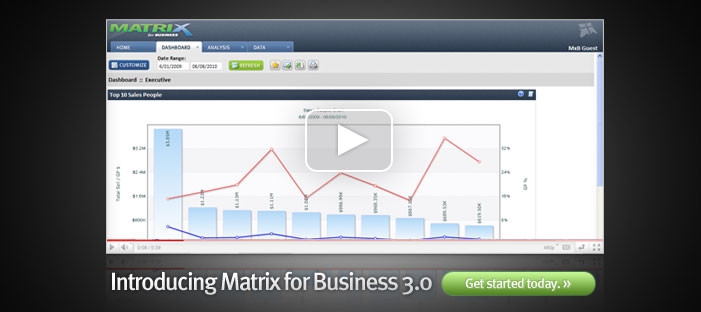
Introducing Matrix for Business 3.0
HOUSTON, TX - Channel Dynamix announces the shipment and release of Matrix for Business version 3.0. The analytics and reporting application provides businesses with the ability to sort, explore, and filter their data. In addition, advanced Flash-based chart visualization provides quick summaries and overviews for executives. The newest version's user experience has been completely redesign and re-engineered from previous versions, to provide an innovative approach to creating filters for large data sets.
Channel Dynamix is a Houston-based technology company which provides business analytics, website development and infrastructure support. Please contact info@channeldynamix.com for additional information.
###
Channel Dynamix is a Houston-based technology company which provides business analytics, website development and infrastructure support. Please contact info@channeldynamix.com for additional information.
###
Tuesday, March 30, 2010
"Excel Hell" - How Matrix for Business can help
We all have our versions of "Excel Hell" aka spreadsheet defeat. Not to say that Excel and spreadsheets should be replaced, but they can quickly get out of hand. They do a fantastic job for analyzing data in an independant setting, but most of us work in groups and need to collaborate.
Here are the top 5 issues our customers have faced:
1. Different versions of the truth - with distributed copies and analysis, you're either repeating work or missing data and conclusions.
2. Complicated and difficult to verify - Think about the hours you've spent creating pivot tables and graphs to demonstrate a particular point only to find out your data is out of date or a certain formula or macro is incorrect.
3. Massive workbooks - Ever receive a locked 35 page spreadsheet with columns that go out to ZZ and 65 thousand rows? How are you suppose to work with that? You're staring at numbers, not understanding them. Ever try printing such a thing?
4. Transfer of knowledge - To be honest, we all probably store vast amounts of data on personal spreadsheets on our machines. What happens when we're not accessible? Who'll knows what is where? How will the knowledge be transferred?
5. Upgrades and versions compatibility - Quick count, how many of you are still on Office 2003? How many of you have run into the 65,536 row limit? Who's still waiting to be upgraded? Exactly.
Business intelligence tools consolidate data from different sources so that you can start making decisions and understanding your data rather than wasting time formatting reports and spreadsheets. It starts by bringing your data into a single source, and creating custom preformatted views such as sales vs. time, marketing conversions vs. mix, gross revenue vs. profitiblity, etc., so in an instant, you're looking at updated and real-time data.
You can share the data views and allow your co-workers to verify and collaborate rather than emailing multiple versions of spreadsheets around. Review monthly, weekly, daily reports without having to copy and paste from one source to another - and hoping the data is valid. Moreover, with drill down capability, you can go from high-level dashboards charts and graphs, to tabular analysis views where you can sort, filter, slice & dice. One more click and you can go all the way down to the needle-in-the-haystack so you can verify and validate individual data points.
Learn how Matrix for Business can help you do all this and more within a few days - without ever calling in a SQL database developer. Oh, and yes, you can export back to Excel if you really want to.
Thursday, March 4, 2010
Matrix for Business - Release 2.3B Video
Missed the webinar? No worries, check it out here!
http://www.channeldynamix.com/matrixforbusiness/webinar.asp
Monday, February 22, 2010
Matrix for Business - Release 2.3B & Upcoming Webinar
Matrix for Business - More is better!
Now with over 60 report views.
Read the latest detailed release notes.
In this release, we added a couple of new views, but mainly focused on making the ones you rely on better. We’ve highlighted a few of our favorites below.
Now with over 60 report views.
Read the latest detailed release notes.
In this release, we added a couple of new views, but mainly focused on making the ones you rely on better. We’ve highlighted a few of our favorites below.
 |  |  |  |
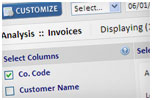
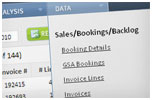
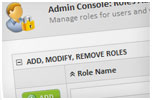
| NEW! Acknowledged Orders with Schedule Alerting We’ve integrated Hedberg Scheduler into MxB to alert you when orders are shipped after your scheduled date. | Enhanced Executive Dashboard Now with GP%, it’s even easier to identify areas that can be improved. | NEW! User Rights Management Who has what rights? Who belongs to what group? Where are rights being duplicated? Now you finally have a view that allows you to see everything side by side. | NEW! Booking Line Sales Code Search booked orders by line sales code. Now you don’t need to wait until an order has been invoiced. |
| Matrix for Business Release Webinar UPCOMING! Did you know we offer training and webinars on Matrix for Business? But it’s our users that teach us how to make MxB better. In fact, we’re having a webinar to go over the latest features in this release – if you have questions or comments, join us and let us know. Join us on March 1, 2010 at 10AM PT, Noon CT, 1PM ET | |
 | Salesforce.com CRM on MxB COMING SOON! We're busy working to integrate salesforce opportunities and leads into MxB. If you're interested in this feature, send us an email, and let's talk about how we can make it fit your needs. |
| Matrix for Business Online Resources If you haven't already, check out the updated MxB Welcome Page: a central location for documentation, feedback and collaboration.Click on the "Welcome" tab on your MxB site or click here to visit the site. |
Monday, February 1, 2010
Who needs BI Software? A case for the Small Business Dashboard
Every business, regardless of industry, requires the basic ability to know whether or not they're operating profitably. Typically this is calculated as a post-mortem exercise, more often using a spreadsheet containing an income and an expenses column. There are two important items to take note of: first, a business can't proactively change its processes to generate higher profits until it's too late; secondly, data is usually inconsistent and inaccurate, take timesheets for example, when collected and reviewed at the end of the project. With some basic Business Intelligence or BI software, a business can utilize a Dashboard that displays the essential information they require in real-time to adjust and make improvements to their bottom line.
Much like a health monitor, the Dashboard shows your business' vital signs, such as gross revenue, gross profit, sales, top sales staff, etc. Layer this on top of an Analysis level where you can expand, collapse, sort and filter, and a Data level to allow you to check the details, and you’ve got a powerful business intelligence platform that can easily help you see profitability. BI software minimizes the two factors, Time and Data Accuracy, that prevent you from responding to changing conditions and increasing your business profitably.
Having the information you need at the right time is extremely vital to understanding the health of your business. With a BI tool that displays real-time information, you can tell if the data your rely on for decisions, such as time entries and expenses, are up-to-date. If time is money, then waiting on printed reports equals lost revenue. A BI tool lets you shift from reviewing out-dated reports to proactively tracking progress.
The second issue, data accuracy, relies on data integration of your business system, your accounting (e.g. QuickBooks), time-tracking (ask us about Time Dynamix) and sales (e.g. Saleforce.com) software. You shouldn't rely on manual time entries or copying and pasting numbers from one or more systems into a spreadsheet. There's no telling the number of errors that can be introduced using this method. By automatically merging your data into one central location, you eliminate uncertainties in your numbers. Consequently, by having a real-time dashboard and analysis tool, you can spot inaccuracies and anomalies in your data before they become a problem. What's more, by centralizing all of your data, you're able to export reports with real-time data and eliminate the confusion of multiple versions floating throughout your business.
The case for any business to have a dashboard to monitor the health of their business is fairly open and shut. But the biggest problem is finding the right software application, price point and support services that can help provide you with the solution. Billion dollar businesses rely on million dollar solutions such as SAP/BusinessObjects and IBM/Cognos and have massive budgets to spend on consulting hours for customization. Smaller businesses with under 500 employees, which make up more than half of the economy, aren't left with many options and tend to rely on cobbling together Excel spreadsheets, Access databases, and attempt costly experiments with SQL and freelance consultants to get the job done.
These are some of the reasons why we developed and continue to enhance Matrix for Business. Combined with our data integration services, we can provide SMBs with an affordable and robust alternative that fills in the gap between spreadsheets and million dollar BI solutions (or disasters). Learn more about Matrix for Business at http://www.matrixforbusiness.com
Also, an excellent source for innovative ideas can be found at http://www.smallbiztrends.com and editor Anita Campbell (@smallbiztrends) who is the inspiration for this post.
Monday, January 4, 2010
2010, The Year of Data
What excites us about this upcoming year is not only the prospect of a better economy, but one that will prosper with the help of maturing information technology. Though it can be extremely helpful, too much irrelevant data can be disruptive. Today, an average American consumes approximately 34 GB of data and about 100,000 words per day!
As we come back from the holiday break, most of us are undoubtedly sifting through the piles of data we left off from last year. We’re neck deep in an age where we’re constantly bombarded with emails, text/instant messages, spreadsheets, reports from last week, and status updates from friends and colleagues.
This seems to be the way of life now, so how do we deal with it?
We recently came upon a TED lecture by Beau Lotto on optical illusions, and what he says about general and sensory information struck a chord with us and what we do here at Channel Dynamix. Here's a snippet:
This is why we work to develop tools like Matrix for Business (MxB), that allow you to analyze your data and view it in a context that provides meaning. MxB lets you visualize trends and filter data to find relationships within the data that's important to you. This work is meaningful to us, and we'll continue to make MxB the premier data integration and analysis platform for SMBs.
At Channel Dynamix, we also create websites and intranet portals that allow you to interact, organize, and share information with the public and your colleagues. Furthermore, we manage networks and servers to protect, store, and control the information you do share. In 2010, rethink the way you analyze, interact, and manage your data. Ask us how we can help.
Finally, let's celebrate this year's many binary days: 010110, 011010, 011110, 100110, 101010, 101110, 110110, 111010, 111110, and may we all enjoy a prosperous new year!
To listen to the full Ted Talk lecture, click here:
Beau Lotto: Optical illusions show how we see | Video on TED.com
As we come back from the holiday break, most of us are undoubtedly sifting through the piles of data we left off from last year. We’re neck deep in an age where we’re constantly bombarded with emails, text/instant messages, spreadsheets, reports from last week, and status updates from friends and colleagues.
This seems to be the way of life now, so how do we deal with it?
We recently came upon a TED lecture by Beau Lotto on optical illusions, and what he says about general and sensory information struck a chord with us and what we do here at Channel Dynamix. Here's a snippet:
"There's no inherent meaning in information, it's what we do with that information that matters. So how do we see? Well, we see by learning to see. So the brain evolved the mechanisms for finding patterns, finding relationships in information and associating those relationships with a behavioral meaning, a significance by interacting with the world."
This is why we work to develop tools like Matrix for Business (MxB), that allow you to analyze your data and view it in a context that provides meaning. MxB lets you visualize trends and filter data to find relationships within the data that's important to you. This work is meaningful to us, and we'll continue to make MxB the premier data integration and analysis platform for SMBs.
At Channel Dynamix, we also create websites and intranet portals that allow you to interact, organize, and share information with the public and your colleagues. Furthermore, we manage networks and servers to protect, store, and control the information you do share. In 2010, rethink the way you analyze, interact, and manage your data. Ask us how we can help.
Finally, let's celebrate this year's many binary days: 010110, 011010, 011110, 100110, 101010, 101110, 110110, 111010, 111110, and may we all enjoy a prosperous new year!
To listen to the full Ted Talk lecture, click here:
Beau Lotto: Optical illusions show how we see | Video on TED.com
Subscribe to:
Posts (Atom)


